Directories
Directory Search Results
Search Results
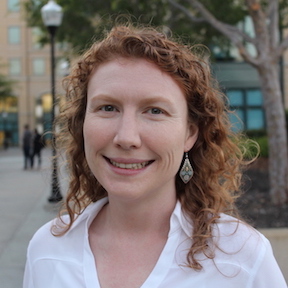
Dr. Joanna Lankester, Ph.D.
Computer Science Instructor
Physical Sciences, Mathematics & Engineering Division
Computer Science
650.949.7259
Email: lankesterjoanna@fhda.edu
Foothill campus
Office Hours:
Posted in Canvas each term; if you don't have access to the course yet, feel free to email me and ask!
Course information:
I mostly teach CS 48A lately.
Here is an FAQ about the course.
Q: What does CS 48A cover?
A: Theory of data visualization; common plots used to represent different types of data; software for producing visualizations; practice using software through projects/assignments; and a few practical data science related tips.
Q: Is the course completely asynchronous?
A: For class meetings, yes; for deadlines, no. The course will not meet in person, and there are no required virtual class meetings. There will be some optional office hours when you can meet with me and classmates synchronously on Zoom to go over any questions you have. We will also have a virtual discussion board or chat where you can ask questions in real time. The assignments do have deadlines, as the course has a schedule aligning with the college term (https://foothill.edu/calendar/).
Q: What software will we use, and do I have to pay for it?
A: We will use Tableau, R, and Python during this course. All software will be free for the duration of the course. Tableau will give us access codes for a free student copy of the software during the course. R and Python are perpetually open-source.
Q: What are the prerequisites for the course?
A: There are no formal prerequisites. There is an advisory (suggestion) for a beginning statistics course. We will only use concepts covered in about the first half of a beginning statistics course. For example, CS 48A includes some drawing of histograms, identification of percentiles, and identification of data with a stronger vs. less strong correlation via a plot. We will also cover these topics.
Q: I'm a perspective dual-enrolled high school student who has taken calculus but not a statistics course. Will I be ok in this class?
A: Yes.
Q: What if I have no/little programming experience?
A: I believe this is doable. The labs will build up step-by-step in difficulty level, and there is computer science tutoring on campus/virtually. You can also come to Zoom office hours or ask questions in the class forums for help. Another option is that you can take a beginning CS course concurrently e.g. CS 49.
Q: Do I need to buy a textbook?
A: No, there is not a required textbook. I have listed an optional textbook with the bookstore, however it is also freely available online: Fundamentals of Data Visualization by Clause Wilke (https://clauswilke.com/dataviz/). You are welcome to buy a hard copy but it is certainly not required for the course.
Another nice book on the topic is The Visual Display of Quantitative Information by Edward R. Tufte.
Q: How much time per week should I budget for the course?
A: Although I cannot guarantee how long it will take for your circumstance, here are statistics from recent surveys of students at the end of the course:
Median: 6 hours/week
~15% of students spent less than 4 hours/week
~15% of students spent more than 10 hours/week
The middle 70% of students spent 4-10 hours/week
Q: I am waitlisted for the course. Will I be able to join?
A: If anyone drops the class before the term begins, students will automatically be enrolled from the top of the waitlist.
Q: The class is full/can you provide an add code?
A: Maybe - please email me and check. The class has been very full in recent quarters, so unfortunately I may not be able to add everyone who wants to join. Please do let me know if you have already reached out to me in a prior term and have been unable to join.
Q: When will the course open up on Canvas/how do I access materials/how can I see the syllabus?
A: On or before the first day of the academic term, the course will open on Canvas. All course materials and the syllabus will be posted there.
Q: Which libraries do you cover at this time in R and Python?
A: The course currently covers ggplot2/dplyr in R, and seaborn/matplotlib/pandas in Python.
Interests:
AI, machine learning, science, computational research, quantitative analysis, tech, biotech, learning
Personal Quote:
time for a new adventure!
Last update: 2023-05-03
Direct directory record link:
https://foothill.edu/directory/directory.html?name=LANKESTER&select=set&s=2